Powerful statistical analysis made accessible
SPSS by IBM is a well-established tool designed to simplify data analysis for students, researchers, and professionals. With its approachable layout and wide range of statistical functions, it delivers both reliability and depth without overwhelming users with unnecessary complexity.
Top Recommended Alternative
User-friendly design with flexible tools
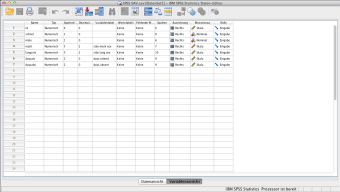
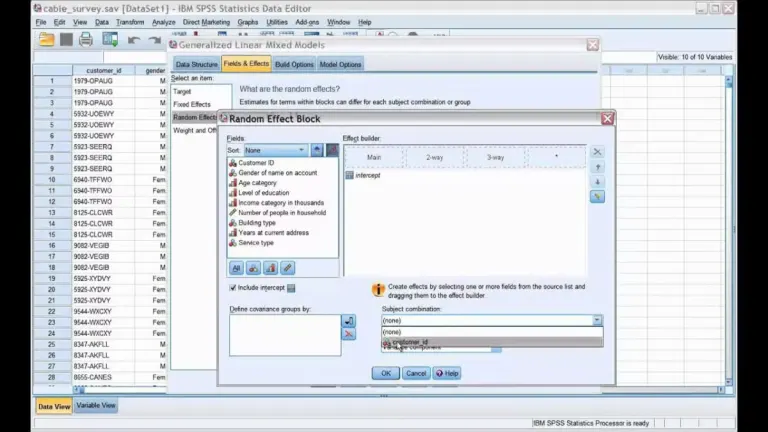
SPSS provides a spreadsheet-like interface that eases the transition for anyone familiar with programs such as Excel. Data View enables straightforward entry, while Variable View allows detailed control over names, types, and measurement scales. This two-panel system keeps information organized and reduces errors by automatically syncing changes across views. The software also offers variable customization, supporting numeric, date, and currency formats alongside scale, ordinal, and nominal measurements, ensuring flexibility across diverse projects.
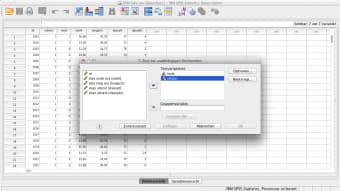
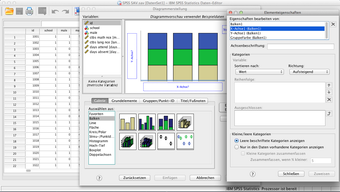
Beyond its layout, SPSS excels in predictive analytics. Researchers and analysts can apply forecasting tools to guide decision-making, with options for saving files in multiple formats to support collaboration. While its emphasis on accessibility makes it suitable for most users, those seeking highly advanced or specialized modeling may find more extensible platforms like R or MATLAB better suited for complex needs.
Final thoughts
SPSS strikes a careful balance between power and ease of use. It is approachable for beginners while still offering advanced functionality for experienced users, making it a trusted choice in both academic and professional settings. Its limitations are most evident for highly technical work, but for general statistical analysis, the combination of accessibility and reliability makes it a strong option.